


TALENT ACQUISITION
Handsome puts importance in diverse workplace
environment through a comprehensive talent acquisition,
and supports employee's capabilities with an extensive training program.
Human Resource Development
Handsome offers training progaram by position for mutual growth with the company.
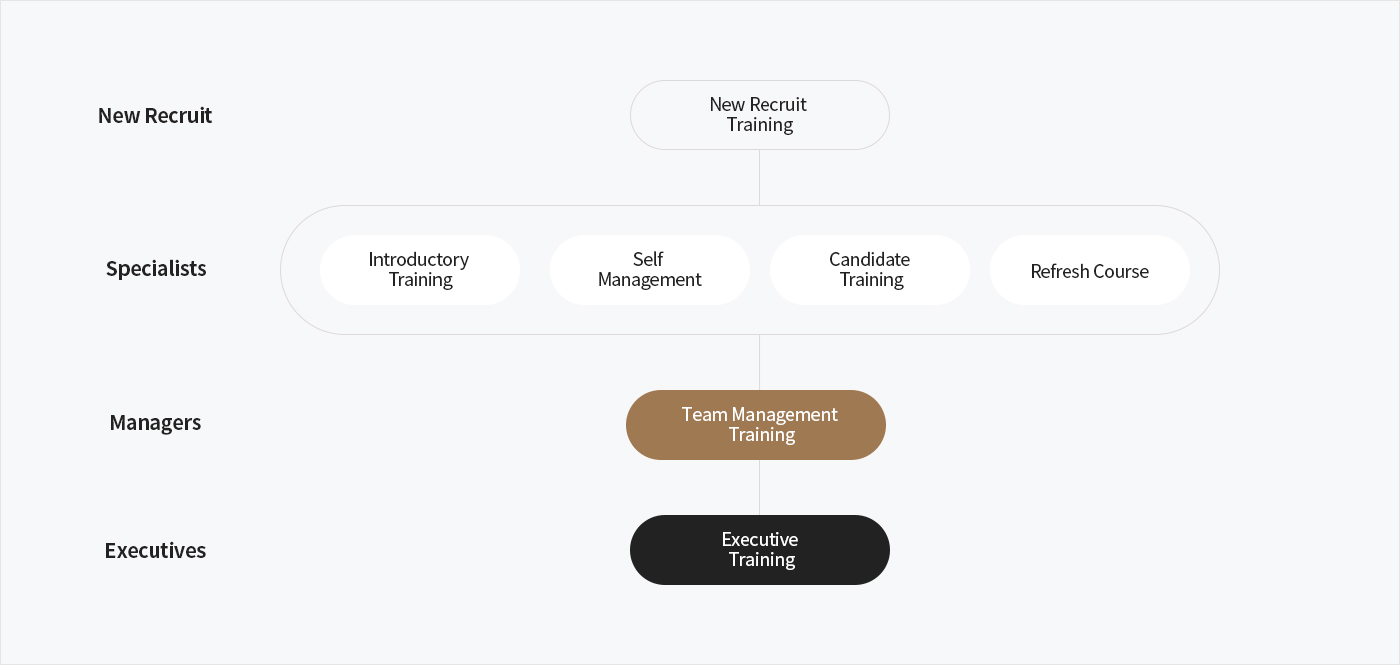
■ 2021 Employee Training Program Summary
| Program | Course Content | No. of Employees | Cost (Million KRW) |
Average Rating |
|
|---|---|---|---|---|---|
| Compulsory | New Recruit Training | Understanding the organization and communication skills Introduction to company |
227 | 569 | 4.32 |
| Introductory Training | Learning leadership capabilities for new position | 195 | |||
| Self-Management | Self-development of diverse capabilities and leadership | 201 | |||
| Candidate Training | Enhance leadership for next position | 51 | |||
| Refresh Course | Refresh and motivation | 135 | |||
| Team Management Training | Leadership and team management OKR, Facilitator Leadership Training |
38 | |||
| Executive Training | Management strategies and risk management Strategic decision making and establishing company's vision |
17 | |||
| Additional Training |
Job Training | Job capability training by team or individual | 198 | ||
| Company College/Graduate School | Nurturing Group's core talents Marketing/ DT / Financials / Business Management etc |
3 | |||
■ Diversity at Handsome in Metrics
(in number of employees, %)
| Classification | 2019 | 2020 | 2021 | Remark | |
|---|---|---|---|---|---|
| Voluntary Turnover | Total Turnover | 138 | 119 | 169 | |
| Voluntary Turnover | 133 (9.1%) | 111 (7.6%) | 139 (9.5%) | ||
| Employment by Gender |
Total | 1,461 | 1,464 | 1,554 | |
| Male | 446 (30.5%) | 445 (30.4%) | 462 (29.7%) | ||
| Executive | 8 (0.5%) | 10 (0.7%) | 12 (0.7%) | ||
| Director | 79 (5.4%) | 74 (5.1%) | 66 (4.2%) | ||
| Staff | 359 (24.6%) | 361 (24.7%) | 384 (24.7%) | ||
| Female | 1,015 (69.5%) | 1,019 (69.6%) | 1,092 (70.2%) | ||
| Executive | 10 (0.7%) | 6 (0.4%) | 8 (0.5%) | ||
| Director | 77 (5.3%) | 69 (4.7%) | 71 (4.5%) | ||
| Staff | 928 (63.5%) | 944 (64.5%) | 1,013 (65.1%) | ||
| Employment by Age Group |
Total | 1,461 | 1,464 | 1,554 | |
| 20's | 289 (19.8%) | 245 (16.7%) | 266 (17.1%) | ||
| 30's | 640 (43.8%) | 659 (45.0%) | 683 (44.0%) | ||
| 40's | 357 (24.4%) | 377 (25.8%) | 390 (25.1%) | ||
| 50's | 143 (9.8%) | 146 (10.0%) | 169 (10.9%) | ||
| 60's | 32 (2.2%) | 37 (2.5%) | 46 (3.0%) | ||
| Employment by Education |
Total | 1,461 | 1,464 | 1,554 | |
| Above Master's Degree | 62 (4.2%) | 61 (4.2%) | 70 (4.5%) | ||
| Bachelor's Degree | 982 (67.2%) | 973 (66.5%) | 1,024 (65.9%) | ||
| Associate Degree and Under | 417 (28.5%) | 430 (29.4%) | 460 (29.6%) | ||
| Employment by Job Segment |
Total | 1,461 | 1,464 | 1,554 | |
| Executive | 16 (1.2%) | 16 (1.1%) | 20 (1.3%) | ||
| Office Employee | 532 (36.3%) | 527 (36.0%) | 569 (36.6%) | ||
| Design (Specialists) | 560 (38.3%) | 564 (38.5%) | 582 (37.5%) | ||
| Production & Development | 353 (24.2%) | 334 (22.8%) | 353 (22.7%) | ||
| Others | 0 (0%) | 23 (1.6%) | 30 (1.9%) | ·Commissioned workers | |
| Disability Employment |
Number of Disability Employment | 30 | 31 | 30 | |
| Rate | 3.1% | 3.3% | 3.0% | ||
| Employment Type | Temporary | 32 | 40 | 62 | |
| Dispatch | 0 | 0 | 2 | ||
| Current Parental Leave |
Parental Leave (Male) | 2 | 1 | 1 | |
| Parental Leave (Female) | 39 | 56 | 44 | ||
| Return Rate (Male) | 100% | 100% | 100% | · Over 1 month of employment | |
| Return Rate (Female) | 76.9% | 80.4% | 100% | ||
※ Counting of employees is based on last business day of year, includes employees on leave of absence